ANC to SHA Turbulence Forecast
Is the Anchorage to Shanghai flight turbulent? Live forecast & historical patterns.
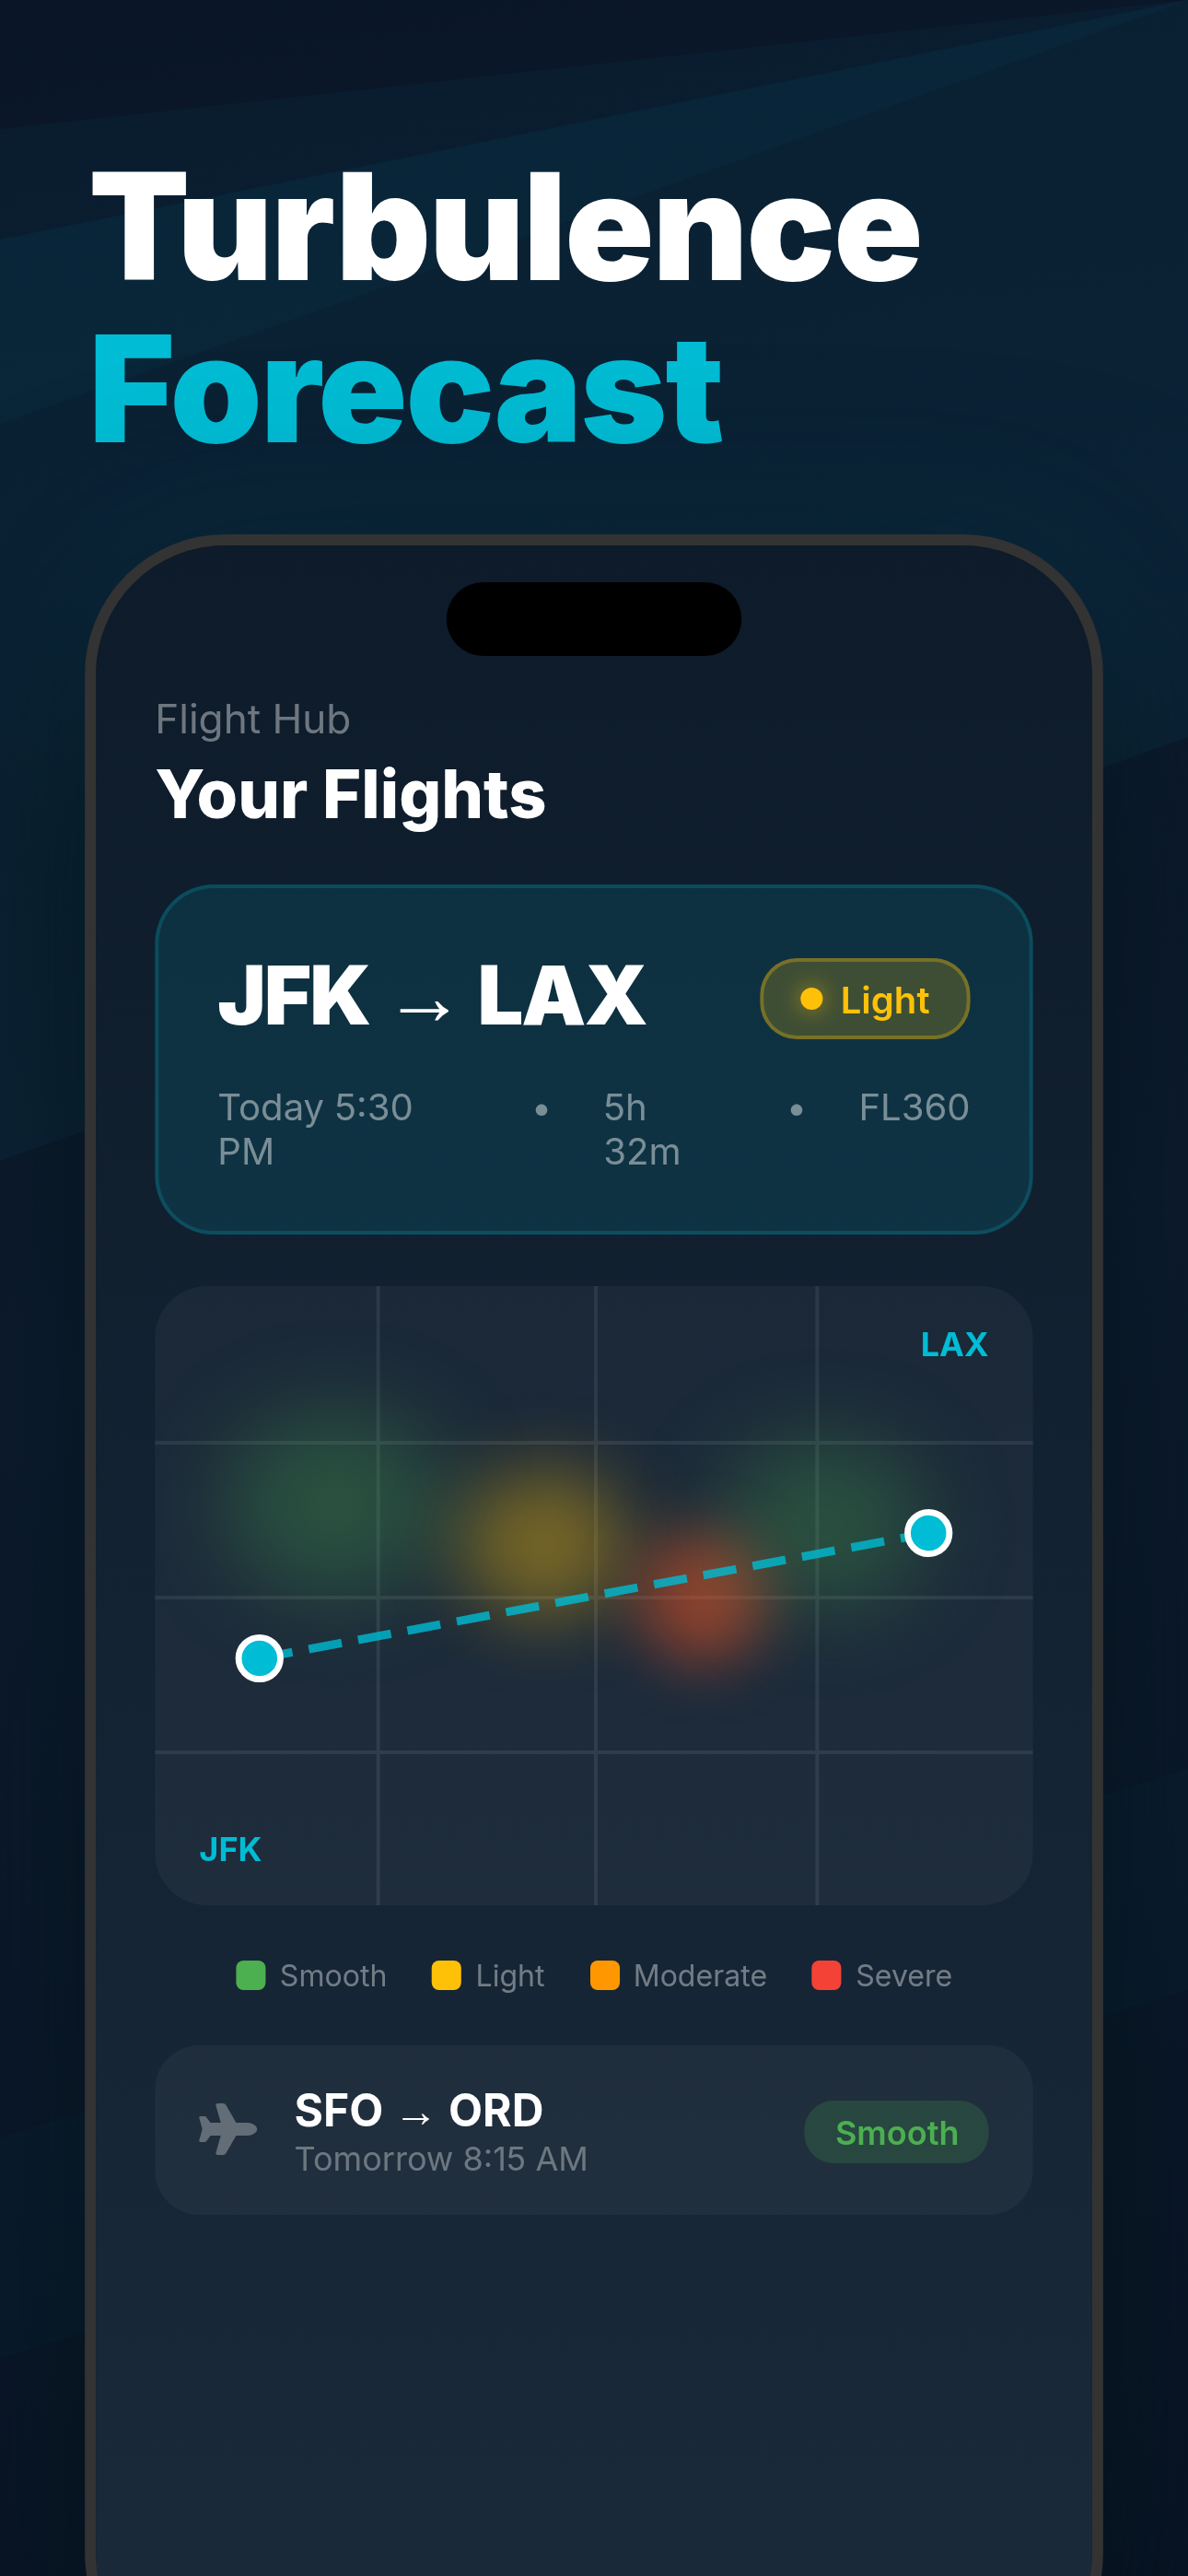

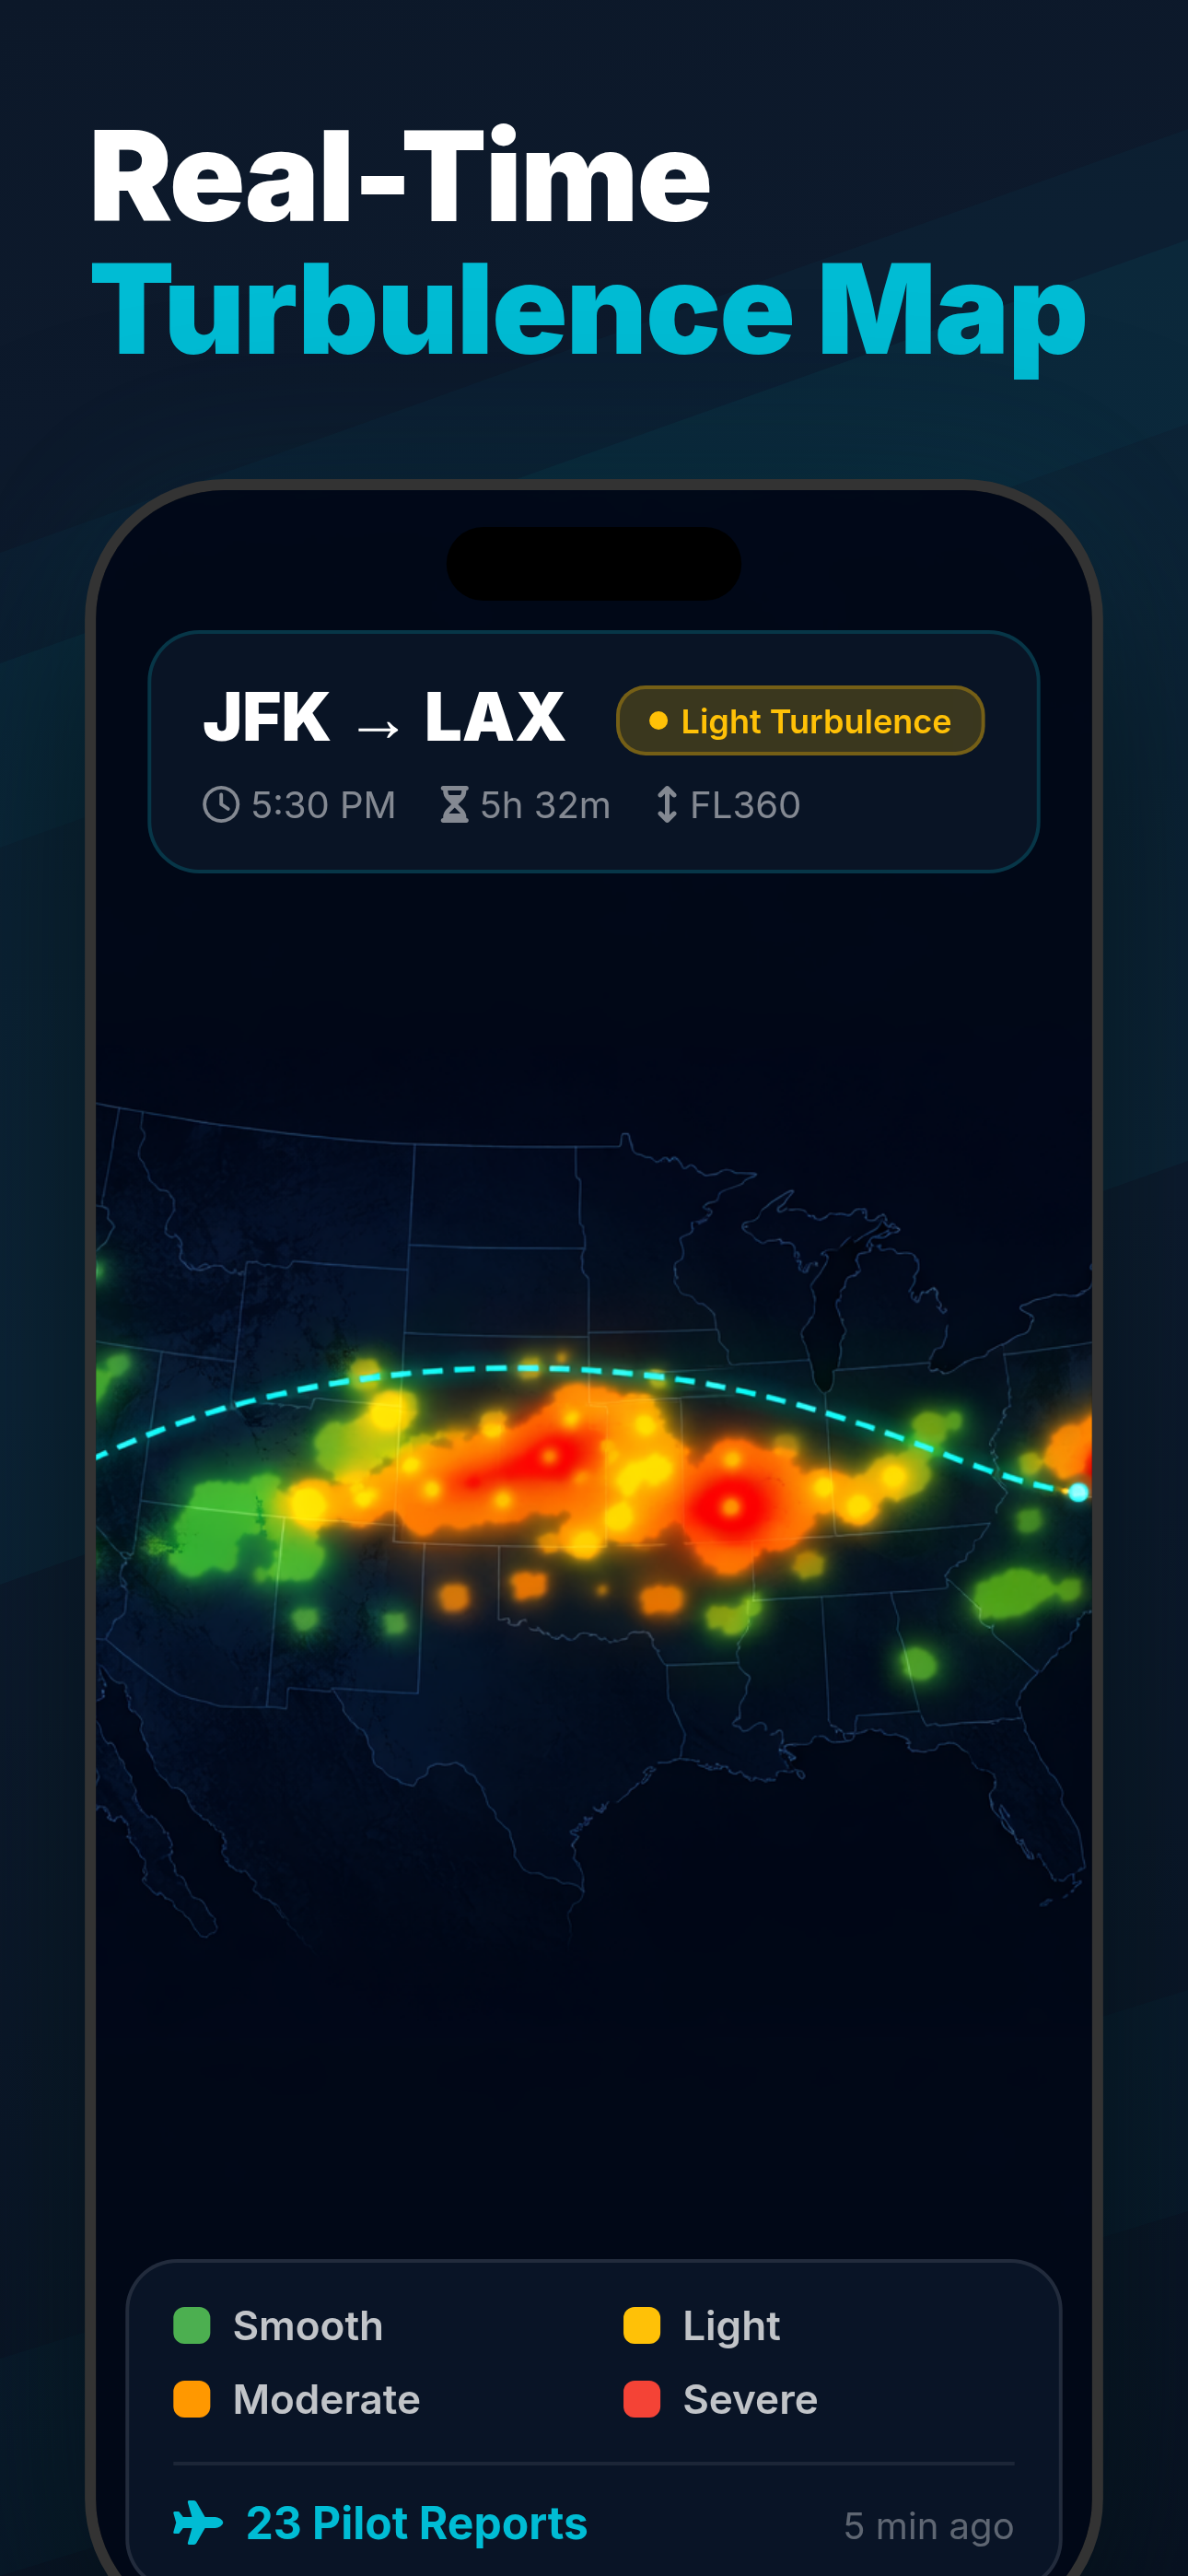
Typical turbulence along the route
Historical average pattern for ANC–SHA
About the ANC–SHA route
The Anchorage to Shanghai route spans the Pacific Ocean — one of the longest commercial flight paths in the world at 4,311 miles. The Pacific jet stream creates moderate turbulence, typically around 3–7 hours into the flight. The sheer length of the route means passengers experience varying conditions: calm stretches punctuated by bumpy patches.
The route is served by United, American Airlines, Delta on Boeing 757 · Airbus A330 aircraft, with flights typically cruising at 37,000 feet over a distance of 4,311 miles (3,746 nautical miles).
💡 Tip: Long flight — turbulence varies throughout. Wing seats significantly reduce motion.
Anchorage to Shanghai Flight Time
How long is the flight from ANC to SHA?
The Anchorage (ANC) to Shanghai (SHA) flight takes approximately 8h 50m, covering 4,311 miles (3,746 nautical miles) at 37,000 feet. The route is operated by United, American Airlines, Delta. Return flights (SHA to ANC) take a similar time, though westbound transatlantic and transpacific routes are typically 30–60 minutes longer due to headwinds.
Turbulence levels on ANC–SHA
What to expect at each phase of the flight
Get minute-by-minute timing for your specific flight
Best time to fly ANC–SHA
Turbulence by month
Best seat on ANC–SHA
Boeing 757
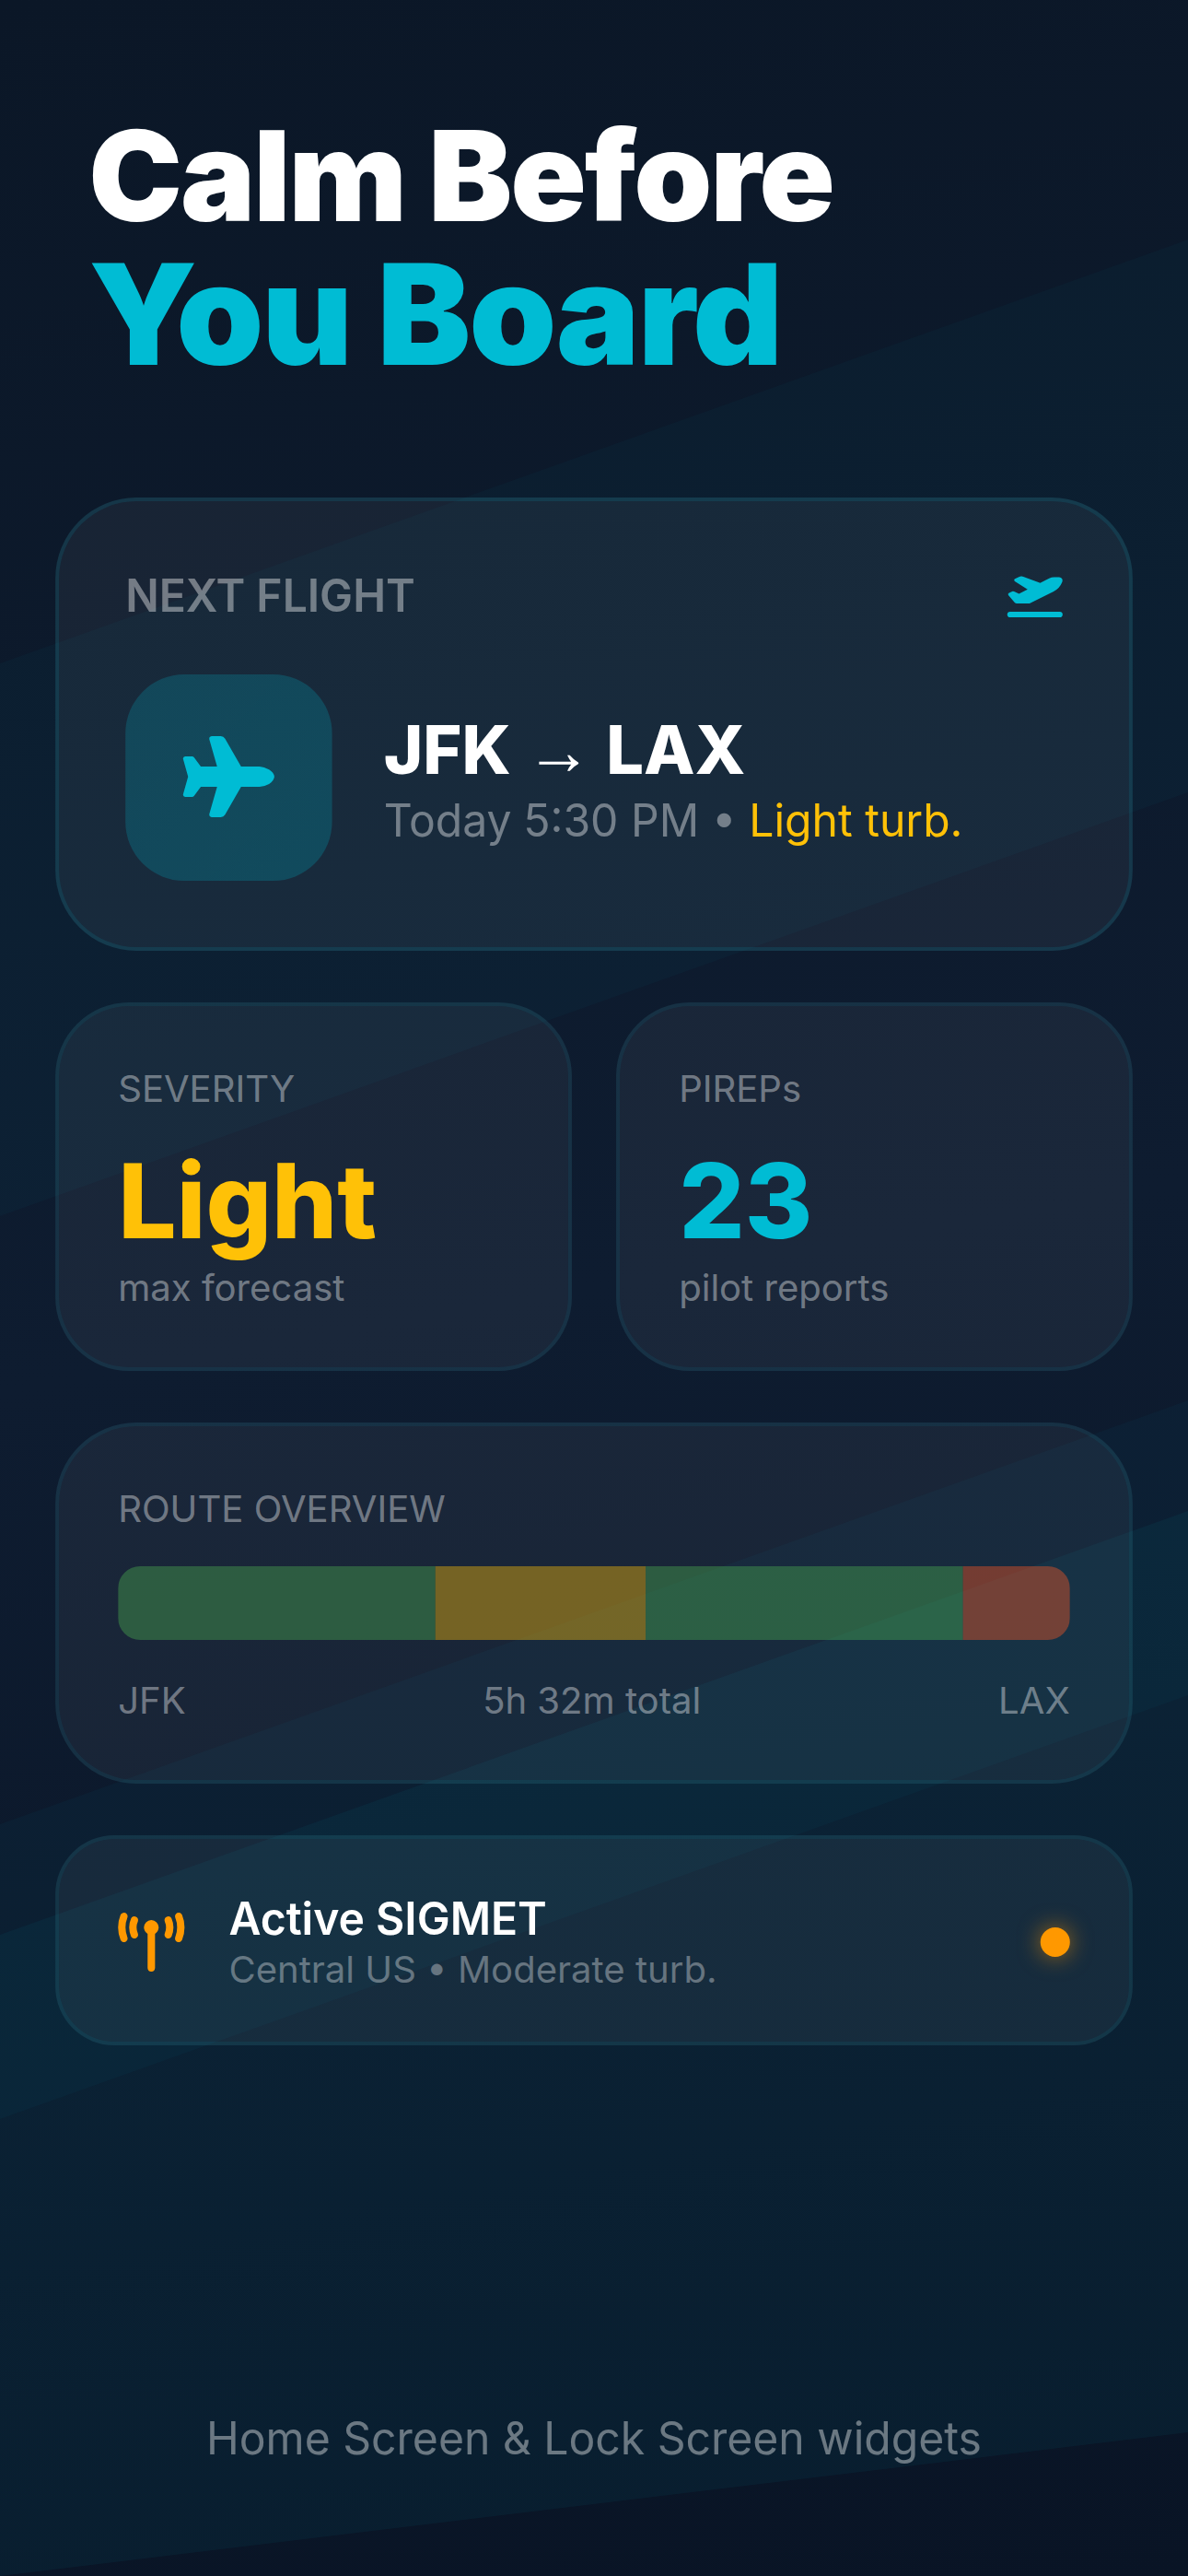
What you'll see in the app
Full forecast, live map & seat recommendations
Similar routes
Other popular routes with turbulence data
Related guides
Learn more about flight turbulence
Passenger Reports
Frequently asked questions
Data Sources
- PIREP — Pilot reports (PIREPs) submitted via FAA/ICAO systems, aggregated over 12+ months of historical data
- SIGMET / AIRMET — Significant Meteorological Information bulletins from NOAA Aviation Weather Center
- EDR data — Eddy Dissipation Rate measurements from commercial aircraft (ADS-B derived turbulence intensity)
- Seasonal patterns — 5-year rolling averages of turbulence frequency and intensity by month for this route
Scores represent typical conditions. Actual turbulence varies daily. For real-time forecasts, use the Turbulence Forecast app. · About our data